


MMM--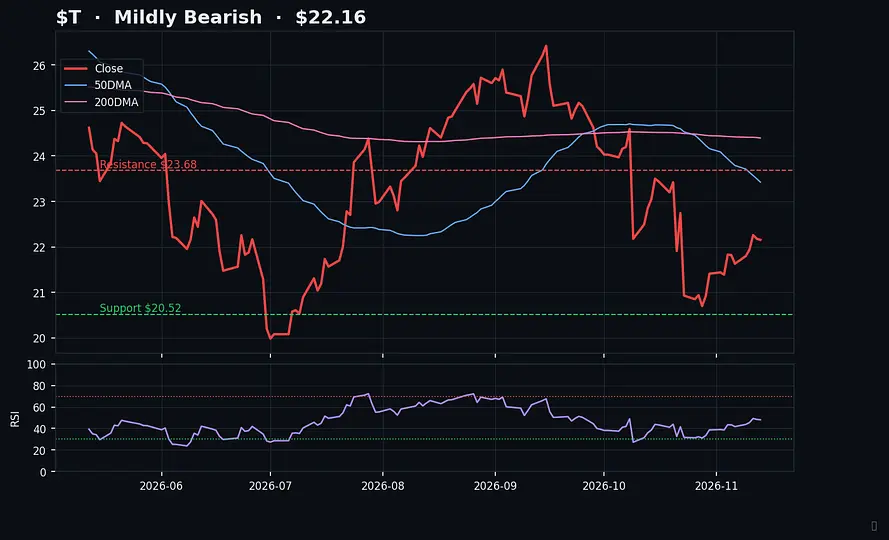
T--
$T Daily Check 🔴 Slightly Negative 📍 $22.16 ( 0.
$T Daily Check 🔴 Slightly Negative 📍 $22.16 (-0.1%) | 1M -5.7% | 3M -9.2% 🏁 vs S&P 500 (3M): 7% behind 📊 Chart Summary • Downtrend: price under 50DMA ($23.42) and 200DMA ($24.39) • RSI 48 is neutral, MACD positive • Volume 0.2x average: light, so confidence is low 🎯 Key Levels Resistance $23.68 (+6.9%) Support $20.52 (-7.4%) Reward:Risk ≈ 0.9:1, balanced 🔭 Scenarios (next 60 trading days) 🟢 Above 50DMA $23.42 → potential to reach ~$24.57 🔴 Below support $20.52 → risk of drop to ~$19.37 Typical range: $17.71 – $26.60 🏦 Analysts: Buy · avg target $27.59 (+25%) 💵 Forward P/E: 8.5 💡 Takeaway: The trend is weak. Buyers need to take back the 50DMA ($23.42) to make things look better.
Disclaimer: The above is a summary showing certain market information. Ainvest is not responsible for any data errors, omissions or other information that may be displayed incorrectly as the data is derived from a third party source. Communications displaying market prices, data and other information available in this post are meant for informational purposes only and are not intended as an offer or solicitation for the purchase or sale of any security. Please do your own research when investing, All investments involve risk and the past performance of a security, or financial product does not guarantee future results or returns. Keep in mind that while diversification may help spread risk it does not assure a profit, or protect against loss, in a down market.Report an Issue
Comments
No comments yet