

INTC--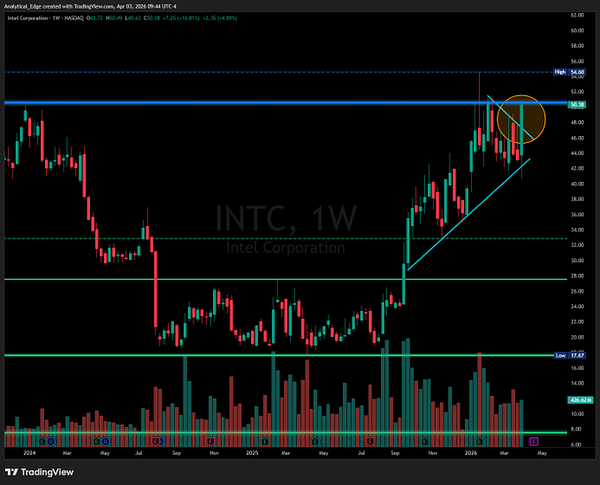
$INTC weekly chart on log scale shows strong momentum 👉Click to view @NasdaqPulse for updates during the choppy market. This week had a clear bullish move and confirmed a breakout on the weekly chart. Bullish energy is growing, and buyers are stepping in confidently. But now we're hitting a major resistance level. This is where it gets exciting. The price is stretched, so next week might see a pullback or rejection from this level. If that happens, a retest of the breakout zone could actually strengthen the trend and improve the risk/reward for the next move up. Key watch: hold the breakout zone → trend stays strong. Lose it → expect deeper consolidation. Big week ahead.
Disclaimer: The above is a summary showing certain market information. Ainvest is not responsible for any data errors, omissions or other information that may be displayed incorrectly as the data is derived from a third party source. Communications displaying market prices, data and other information available in this post are meant for informational purposes only and are not intended as an offer or solicitation for the purchase or sale of any security. Please do your own research when investing, All investments involve risk and the past performance of a security, or financial product does not guarantee future results or returns. Keep in mind that while diversification may help spread risk it does not assure a profit, or protect against loss, in a down market.Report an Issue

ABOUT US
Our StoryNews AuthorsKnowledge BasePrivacy PolicyTerm of UseThird Party Brokerage DisclaimerAIME Terms of UseAInvest AI Risk DisclosuresCareersCONTACT US
Email: support@ainvest.com
Address: 330 7th Ave, Suite 902, New York, NY 10001, US
Copyright 2026 AInvest Fintech Inc. All rights reserved.
Comments
No comments yet