

AMD--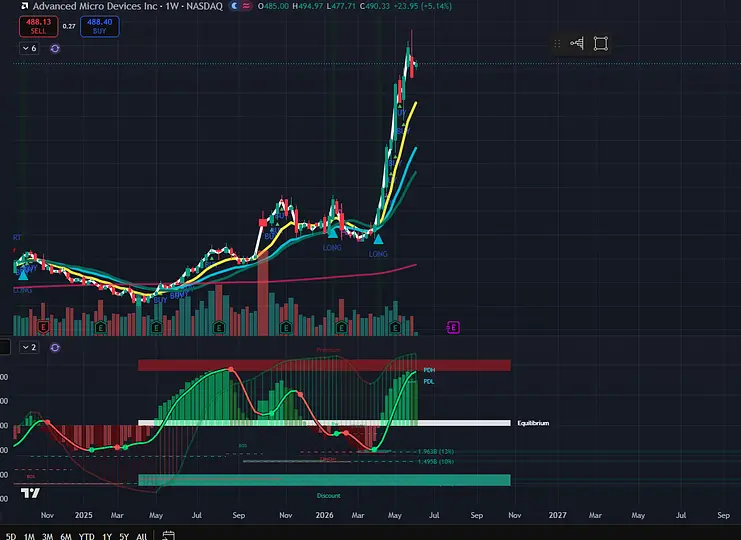
NVDA--
TSLA--
amd weekly chart staying in moving averages
$AMD Hey everyone who's new, clueless, or just saying sell. Here's a weekly chart. This chart says don't sell... Learn something so you don't look silly when you post nonsense. You don't sell when your moving averages are pointing up fools. You wait for the candle to close below one of them before even thinking about selling. Pick any moving average it's about how strong it is. In this case yellow is 9 ema and turquoise is 20 ema Check out big winners like: NVDA in 2023–2024 TSLA in 2020–2021 The biggest gains came from staying in when the weekly 9 stayed above the weekly 20.
Disclaimer: The above is a summary showing certain market information. Ainvest is not responsible for any data errors, omissions or other information that may be displayed incorrectly as the data is derived from a third party source. Communications displaying market prices, data and other information available in this post are meant for informational purposes only and are not intended as an offer or solicitation for the purchase or sale of any security. Please do your own research when investing, All investments involve risk and the past performance of a security, or financial product does not guarantee future results or returns. Keep in mind that while diversification may help spread risk it does not assure a profit, or protect against loss, in a down market.Report an Issue

CONTACT US
Email: support@ainvest.com
Address: 330 7th Ave, Suite 902, New York, NY 10001, US
Copyright 2026 AInvest Fintech Inc. All rights reserved.
Comments
No comments yet