

NVDA--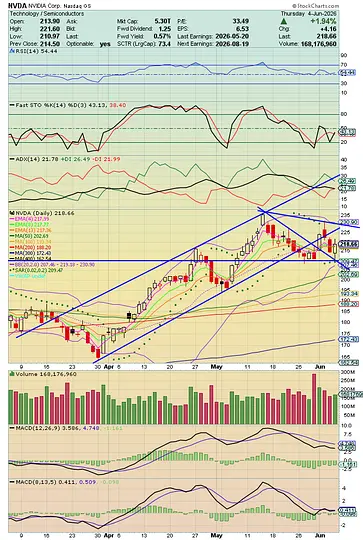
QQQ--
SMH--
SOXX--
SPY--
nvda daily chart key point ema bollinger band
$NVDA Daily Chart Hitting a key point where EMAs 4,8,13 and the middle Bollinger Band at 219.18 are meeting Keep it simple 💯 Bullish above 220 Bearish below 218 Above middle bb = up trend continues Below middle bb = possible downtrend There was a lower high on the last bounce and a higher low on this bounce Price is tightening / the direction it moves could decide the market soon $SPY $QQQ $SMH $SOXX
Disclaimer: The above is a summary showing certain market information. Ainvest is not responsible for any data errors, omissions or other information that may be displayed incorrectly as the data is derived from a third party source. Communications displaying market prices, data and other information available in this post are meant for informational purposes only and are not intended as an offer or solicitation for the purchase or sale of any security. Please do your own research when investing, All investments involve risk and the past performance of a security, or financial product does not guarantee future results or returns. Keep in mind that while diversification may help spread risk it does not assure a profit, or protect against loss, in a down market.Report an Issue

CONTACT US
Email: support@ainvest.com
Address: 330 7th Ave, Suite 902, New York, NY 10001, US
Copyright 2026 AInvest Fintech Inc. All rights reserved.
Comments
No comments yet